CKM Constraints from Charmless B Decays:
Winter 2004
|
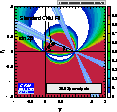
Confidence levels in the large (rhobar,etabar) plane
obtained from the isospin analysis using BABAR and Belle (Cpipi, Spipi) average.
(Results with (Cpipi, Spipi) from BABAR or Belle) |
 eps eps |
|
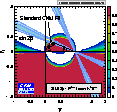
Confidence levels in the large (rhobar,etabar) plane obtained from unbroken
SU(3) symetry using BABAR and Belle (Cpipi, Spipi) average. P is evaluated
with the upper bound |P|<|P(B0 -> K+pi-)|.
(Results with (Cpipi, Spipi) from BABAR or Belle) |
 eps eps |
|
Confidence levels in the large (rhobar,etabar) plane obtained from broken SU(3) symetry using BABAR and Belle (Cpipi, Spipi) average. P is evaluated with |P|=fpi/fK.|P(B+ -> K0pi+)|, taking into account other small correction factors.
(Results with (Cpipi, Spipi) from BABAR or Belle) |
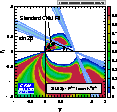 eps eps |
|
Confidence levels in the large (rhobar,etabar) plane obtained using QCD FA and BABAR and Belle (Cpipi, Spipi) average. The main uncertainty comes from the parameterization of non-factorizable contributions (annihilation and hard-spectator diagrams).
(Results with (Cpipi, Spipi) from BABAR or Belle) |
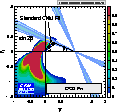 eps eps |
|
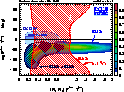
Constraints on the penguin-to-tree ratio P/T and the relative strong phase, when the CKM
phase is constrained by means of the standard CKM fit. The colored region gives the confidence
levels obtained from the isospin analysis. Also shown are the 95% level contours from: the SU(3) analysis (blue hatched area); the B+ -> K0pi+ decay (red hatched area); QCD FA "leading order" (no non-factorizable contributions, dark blue area); QCD FA full calculation (light blue area). (Results with (Cpipi, Spipi) from BABAR or Belle) |
 eps eps |
| Constraints on the penguin-to-tree ratio P/T and the relative strong phase, when the CKM phase is constrained by means of the standard CKM fit. Again, the colored region gives the confidence levels obtained from the isospin analysis, using as input the BABAR and Belle (Cpipi, Spipi) average. The blue (resp. red) hatched area corresponds to the 95% contour obtained with the BABAR (resp. Belle) results. |
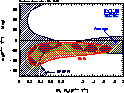 eps eps |
|
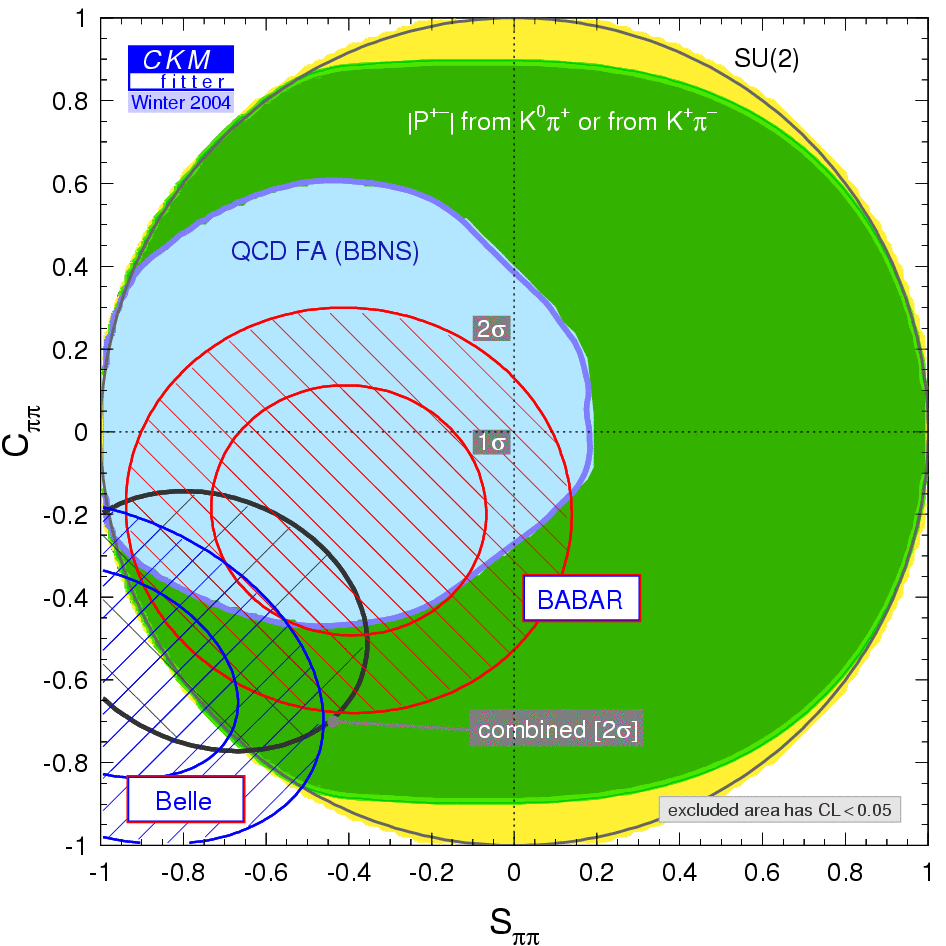
Predictions for Spipi and Cpipi within the four frameworks. The input values for rhobar and etabar are taken from the standard CKM fit. For comparison, the 1 sigma and 2 sigma contours for the experimental results from BABAR, Belle and their average are overlaid. |
 eps eps |
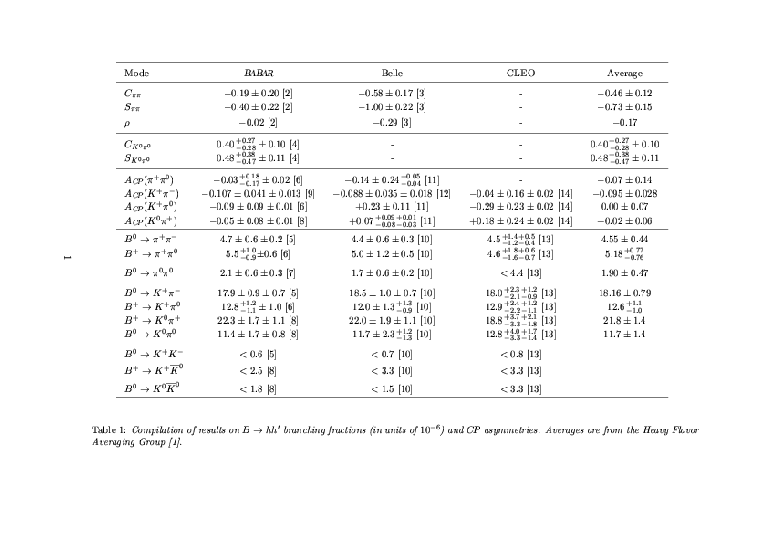
| Compilation of results on B --> hh' branching fractions and CP asymmetries (references). |
 eps eps |